
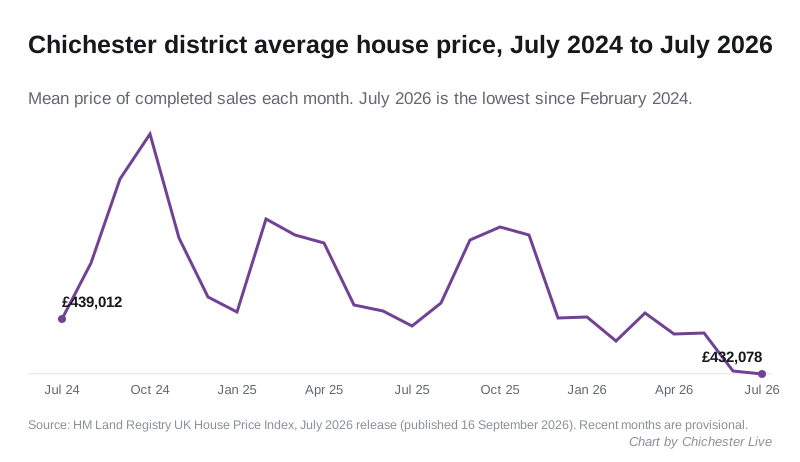
July's district average is the lowest since February 2024. Flats fell 4.1%, and Horsham's lead as West Sussex's dearest district has doubled to £9,576.
The average home in Chichester district sold for £432,078 in July 2026. That is £5,980 less than a year earlier, a fall of 1.4 per cent. It is the lowest monthly figure since February 2024. England as a whole rose 1.1 per cent over the same year.
The figures come from the July 2026 release of the UK House Price Index, which HM Land Registry compiles from completed sales. It was published on 16 September.
The fall is small. The pattern behind it is not. The district’s annual change has been below zero in 14 of the last 15 months, going back to May 2025. The one exception was November 2025, at plus 0.1 per cent.
Horsham has pulled away
Chichester was the most expensive district in West Sussex until the middle of 2025. Horsham first went ahead in July 2025, dropped back in September and October, and has been ahead every month since November 2025.
Until now the gap has been small. Between November 2025 and June 2026 it never went above £4,421. In July it more than doubled, to £9,576. Horsham rose 1.1 per cent in the month to £441,654, while Chichester slipped 0.1 per cent.
| District | Average price | Change on a year | Annual change |
|---|---|---|---|
| Horsham | £441,654 | +£2,887 | +0.7% |
| Chichester | £432,078 | -£5,980 | -1.4% |
| Mid Sussex | £430,777 | -£952 | -0.2% |
| Adur | £380,120 | +£4,996 | +1.3% |
| Crawley | £332,384 | +£7,553 | +2.3% |
| Arun | £321,460 | +£2,919 | +0.9% |
| Worthing | £297,200 | -£12,108 | -3.9% |
For comparison, West Sussex as a county is down 0.1 per cent at £373,740. The South East is up 0.2 per cent at £380,878. England is up 1.1 per cent at £293,479.
Where Chichester sits in England
Across all 295 local authority districts in England, 85 recorded a fall in the year to July. Chichester’s 1.4 per cent drop is the 48th steepest. Worthing’s 3.9 per cent is the 19th steepest.
Two Hampshire neighbours across the county line are falling at almost the same rate. Havant is down 1.2 per cent at £315,820, and East Hampshire is down 1.2 per cent at £440,541.
The district’s peak was £466,419 in October 2022. July 2026 is £34,341 below it, a fall of 7.4 per cent.
Flats are still falling fastest
The index splits the district’s sales by property type. Over the twelve months to July 2026:
- Detached: £686,523, down 1.4 per cent
- Semi-detached: £426,369, down 0.2 per cent
- Terraced: £345,877, down 0.7 per cent
- Flats and maisonettes: £217,163, down 4.1 per cent
Flats were also the steepest faller in June, down 3.8 per cent on the revised figures. They are the cheapest way into the district, so this is the part of the market first-time buyers use most.
The first-time buyer average is £338,948, down 1.2 per cent. Former owner-occupiers moving home paid an average of £514,980, down 1.4 per cent.
June was not as bad as first published
Land Registry revises recent months as more sales are registered, and the June figure has moved a long way.
- June 2026 was first published at £429,978, down 2.3 per cent on the year. It now stands at £432,369, down 1.7 per cent.
- May 2026 has moved twice. It was first published at £436,312, revised to £433,881 a month later, and now stands at £437,152.
- The June ranking moved too. We reported June’s fall as the 25th steepest of 295 districts. On the revised figures it is the 36th.
We have added a dated note to our June house prices story. Treat the July figure the same way: anything under three months old is provisional.
One number that is not what it looks like
UKHPI is a mean average of sales, not a median. A few large sales in the villages, or a quiet month in the city, will move it. It is a good guide to the direction the district is travelling in and a poor guide to what any particular house is worth.
Sales counts lag further still. Figures for June and July 2026 are not published yet, and the months before are still filling in as sales register.
What it means for you
If you are buying, the district is drifting down, not falling sharply. The type of home matters more than the timing: flats are down 4.1 per cent on the year, semis 0.2 per cent.
If you are selling, the average has been below its level of a year before in 14 of the last 15 months. If your price is anchored on 2024 or 2025 sales nearby, it is worth checking it against recent completions.
If you are staying put, none of this changes your council tax. Bands are set on 1991 values and do not move with the index. The bands and this year’s bills are on our council tax page.
We will report the August 2026 figures when the Land Registry publishes them in October.
Sources
- UK House Price Index, Chichester, July 2024 to July 2026, HM Land Registry
- UK HPI full data file, July 2026, HM Land Registry, for every district’s figures, the England ranking and the revised May and June figures
More Chichester information: house prices in detail, by street and property type, planning news, roadworks and travel and trains to London.
Have your say