
Chichester district had 2,385 people on the claimant count in October 2026. That is 80 more than in September and 80 more than a year earlier, the highest count since April.
The year’s rise is 3.5 per cent. Across West Sussex the count rose 6.0 per cent, and across England 3.3 per cent. Chichester’s claimant rate is 3.3 per cent of residents aged 16 to 64.
The figures are the ONS and DWP claimant count, published through nomis on 17 November 2026.
The under-25 rise has sped up
Last month the under-25 rise here was in line with the county. In October it pulled ahead. Year on year, across the district:
- 16 to 24: up from 345 to 410, a rise of 65, or 18.8 per cent
- 25 to 49: down from 1,320 to 1,275, a fall of 45, or 3.4 per cent
- 50 and over: up from 640 to 700, a rise of 60, or 9.4 per cent
The under-25 rise compares with 12.4 per cent across West Sussex, where the count went from 2,905 to 3,265. Across England it was 9.1 per cent, from 278,540 to 303,855.
October’s 410 under-25 claimants matches February 2026, the highest monthly figure for that age group in the last two years. A year ago the number was rising through the winter too: it went from 345 in October 2025 to 410 by February.
The 25 to 49 group is still the one that sets Chichester apart. It is lower than a year ago here, as it was in September.
September was revised down by 20
Last month we reported a September count of 2,325. In this release the ONS has revised it to 2,305, the same as September 2025, so the year-on-year change in September was nil rather than a rise of 20. The 25 to 49 figure for September went from 1,280 to 1,260.
Claimant counts are routinely revised a month after first publication, as late claims are processed. We have added a dated note to our September story.
How Chichester compares across West Sussex
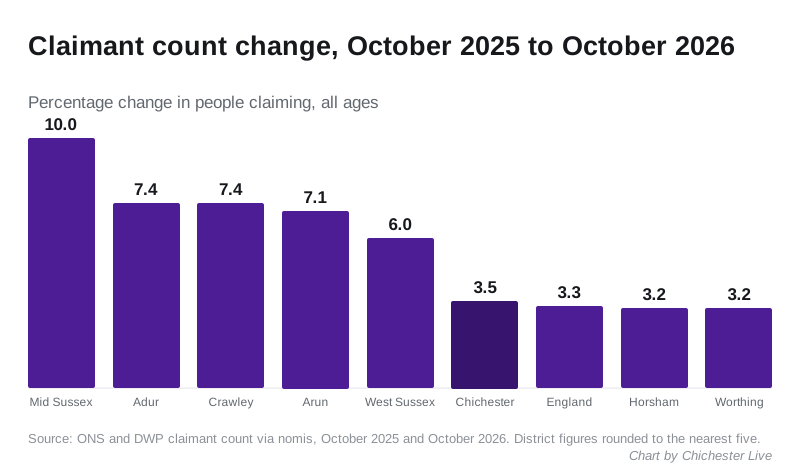
| District | October 2026 | Rate | Change on the year |
|---|---|---|---|
| Crawley | 3,790 | 4.7% | +260 (+7.4%) |
| Arun | 3,540 | 3.7% | +235 (+7.1%) |
| Chichester | 2,385 | 3.3% | +80 (+3.5%) |
| Worthing | 2,240 | 3.2% | +70 (+3.2%) |
| Mid Sussex | 2,090 | 2.2% | +190 (+10.0%) |
| Horsham | 1,775 | 2.0% | +55 (+3.2%) |
| Adur | 1,160 | 3.1% | +80 (+7.4%) |
West Sussex as a whole has 16,975 claimants, up from 16,010 a year earlier. Chichester’s overall rise is the third smallest of the seven districts, after Horsham and Worthing.
Nomis rounds district figures to the nearest five, so small changes should not be read too precisely.
Eight Octobers
The district’s October count over the last eight years:
- 2019: 1,225
- 2020: 3,205
- 2021: 2,510
- 2022: 1,925
- 2023: 2,020
- 2024: 2,325
- 2025: 2,305
- 2026: 2,385
This is the highest October count since 2021. It is still well below the pandemic peak of 2020, and almost double the pre-pandemic October of 2019.
What the claimant count counts
The claimant count is not an unemployment rate. The ONS says so in its own methodology. It counts people claiming Jobseeker’s Allowance, plus Universal Credit claimants who are required to look for work. Someone working part time on low pay can be in it. Changes to who must look for work can move the number without anything changing locally.
What it means for you
- If you are 16 to 24 and looking for work here, more people your age are claiming than at any point since February. Last winter the number kept rising until February.
- If you are 25 to 49, claimant numbers in your age group are lower than a year ago, as they were in September.
- If you are 50 or over, the count in your age group is up 60 on the year, to 700.
For the spread between wards, see our ward breakdown. The November figures are due in mid-December.
Have your say