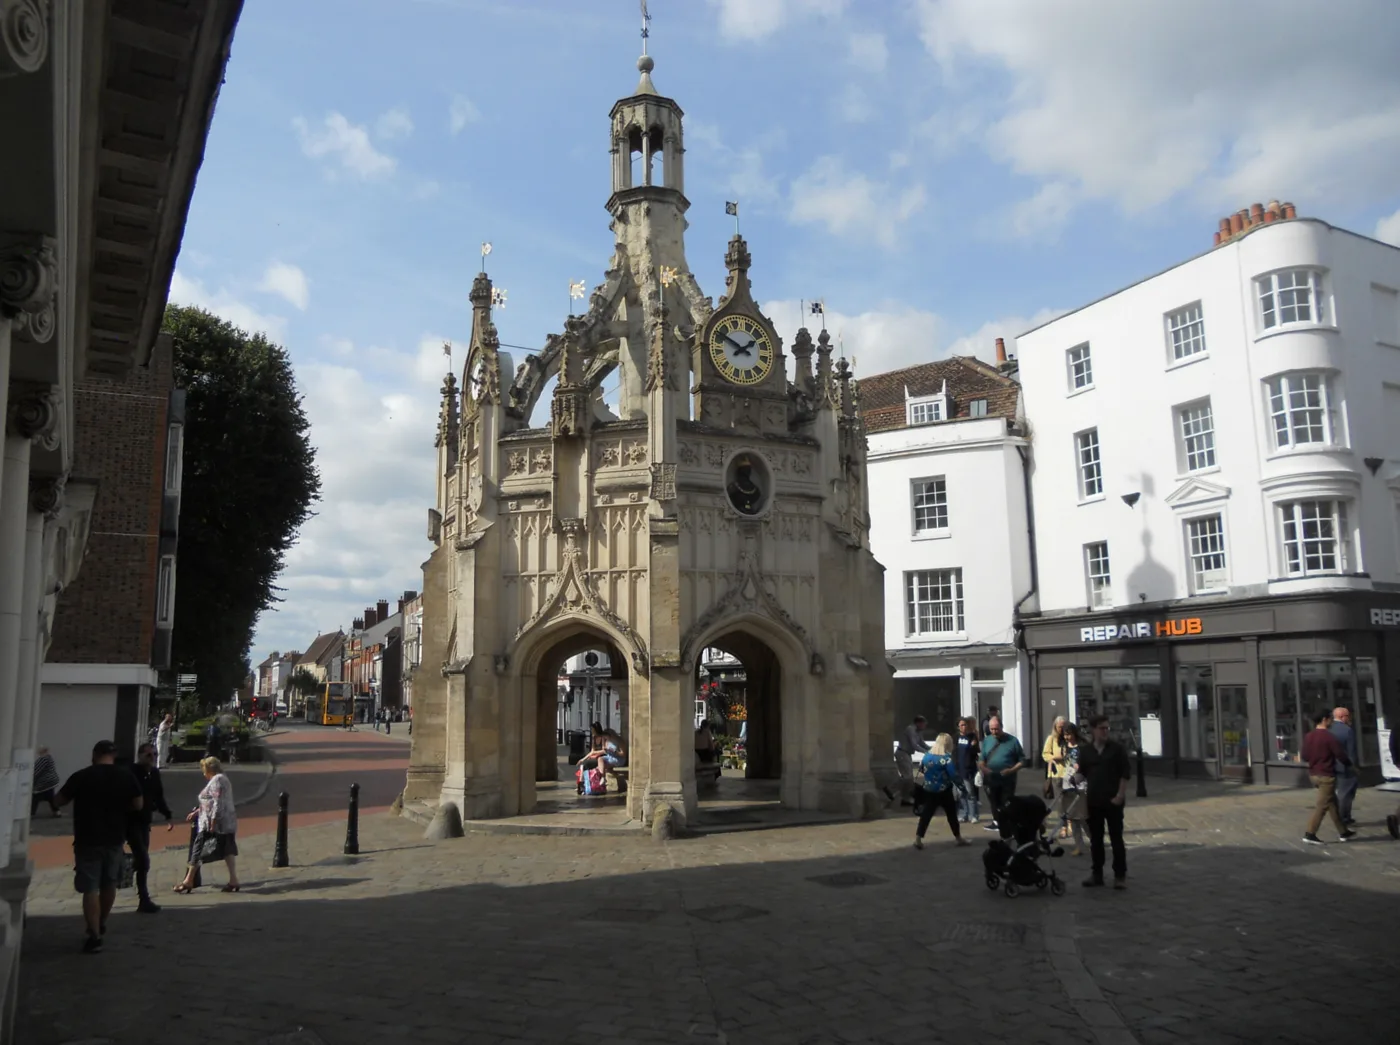

Chichester Central has the 4th highest claimant rate of West Sussex's 133 wards at 6.0%. Loxwood, at the district's northern edge, is on 1.3%.
Chichester district’s claimant count barely moved in the year to July 2026, but the ward figures underneath it are nothing like each other. Chichester Central, the ward that holds the Cross and most of the shopping streets, has 6.0 per cent of its working-age residents claiming unemployment-related benefits. Loxwood, at the far northern edge of the district, has 1.3 per cent.
That is a four-and-a-half-to-one gap inside one local authority, and the district’s own average of 3.2 per cent sits in the middle of it describing neither end.
The figures are the ONS and DWP claimant count for July 2026, published through nomis. We pulled them for all 21 wards in the district and for every ward in West Sussex.
What the district total says
Chichester district had 2,315 claimants in July 2026, 3.2 per cent of residents aged 16 to 64. A year earlier it was 2,280, or 3.1 per cent. That is 35 more people, a rise of 1.5 per cent, which is about as close to no change as this series gets.
Against everywhere else, the district looks unremarkable:
- United Kingdom: 3.9 per cent
- South East: 3.1 per cent
- West Sussex: 3.1 per cent
- Chichester district: 3.2 per cent
Within the county, Chichester is joint fourth of seven districts, level with Adur. Crawley is on 4.5 per cent, Arun 3.7 and Worthing 3.3. Horsham, on 1.9 per cent, is the lowest.
The ward figures tell a different story
Chichester Central’s 6.0 per cent is not just the highest in the district. It is the fourth highest of all 133 wards in West Sussex. Only River and Marine, both in Arun, and Southgate in Crawley are above it.
Three more city wards are in the county’s top 25: Chichester East on 4.6 per cent, Chichester West on 4.2 and Chichester South on 3.6. Selsey South is on 4.2 per cent and Sidlesham with Selsey North on 4.0, which puts both halves of Selsey in the top 30.
At the other end, Loxwood is 128th of 133 and Fittleworth 121st. The rural north of the district, from Loxwood across to Harting, sits between 1.3 and 2.1 per cent throughout.
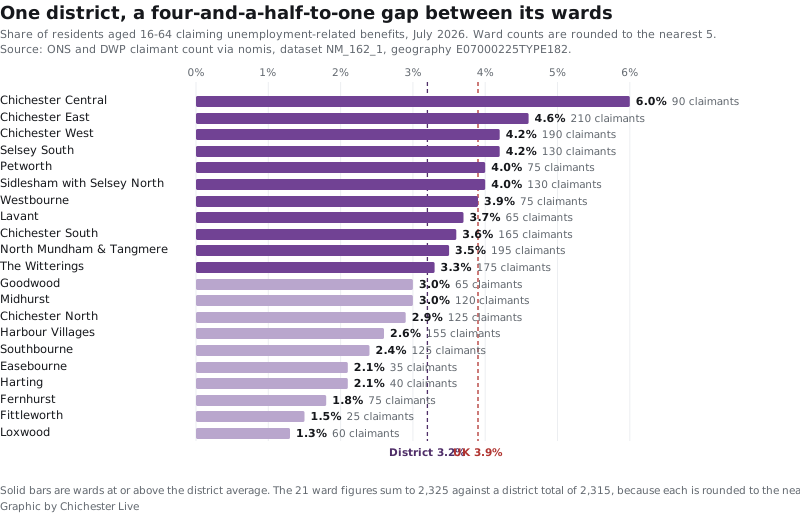
One caveat on the chart. Every ward figure in this series is rounded to the nearest five, so the 21 wards add up to 2,325 against a district total of 2,315. Treat the small wards, Fittleworth on 25 and Easebourne on 35, as approximate.
The claimant count is not the unemployment rate
It is worth being clear about what this measures. The claimant count records people claiming benefits principally for being unemployed. Since Universal Credit, that includes some people who are working but on low earnings and required to look for more work. It is not the ONS unemployment rate, and it is not a count of people out of work. What it is good for is comparing one place with another on the same basis, month by month, right down to ward level.
Where the movement actually is
The district total has been effectively flat for two years: 2,295 in July 2024, 2,280 in July 2025, 2,315 now. Split it by age and one band has moved:
| Age | July 2024 | July 2025 | July 2026 | Two-year change |
|---|---|---|---|---|
| 16 to 24 | 270 | 335 | 355 | +31% |
| 25 to 49 | 1,360 | 1,295 | 1,300 | -4% |
| 50 and over | 665 | 650 | 655 | -2% |
| All ages | 2,295 | 2,280 | 2,315 | +1% |
Young claimants are up by 85 in two years while the two older bands are slightly down. The UK’s under-25 count rose 16 per cent over the same two years, so Chichester’s 31 per cent is roughly twice the national pace.
The last twelve months are a different matter, and it would be wrong to write them up as a local crisis. Chichester’s under-25 count rose 6.0 per cent in the year to July 2026. West Sussex as a whole rose 15.4 per cent, the South East 12.2 per cent and the UK 9.7 per cent. On the most recent year, the district’s youth figure is rising more slowly than the county it sits in.
What has changed since January
Ward-level claimant figures only start in January 2026 on the current ward boundaries, so there is no year-ago ward comparison to make. Over the seven months there are:
- Goodwood, down 20 to 65, the largest fall in the district
- North Mundham and Tangmere, down 15 to 195
- Chichester Central, Chichester South and Selsey South, each down 10
- Petworth, up 10 to 75, the only ward up by more than 5
Chichester Central’s rate is the district’s highest even after a fall. It was on 100 claimants in January.
What it means for you
If you are looking at these numbers to work out whether the district is in trouble, the honest answer is that as a whole it is not, and that the district figure is the wrong unit to look at. Chichester Central and Loxwood are in the same council area, pay to the same authority and appear in the same national statistic, and they are not experiencing the same labour market at all.
For anyone claiming, the practical routes are the same wherever in the district you live. West Sussex County Council’s Adult Learning Service runs routes into employment courses, free to anyone aged 19 or over living or working in the county, alongside free English, maths and digital skills courses. For 16 to 25 year olds the council’s Your Space pages carry its advice on work and training. Jobcentre contact details are on GOV.UK.
If you want to check your own ward rather than take the district average, the ward figures are free to query on nomis: choose “Claimant count by sex and age”, then wards.
We will report the August figures when they are published in September, and we will keep watching the under-25 line, which is the only one moving.
More Chichester information: house prices, planning news, roadworks and travel and things to do in Chichester.
Have your say