
Chichester district registered 975 births in 2025, 18 more than in 2024, while England fell 1.5%. Over ten years births are down 7%, half the national fall.
Babies born to mothers living in Chichester district rose to 975 in 2025, up from 957 the year before. England went the other way: births there fell by 1.5%.
The figures come from the Office for National Statistics’ birth registrations for 2025, published in September. They count births by where the mother lives, not where the baby was born, so a Chichester mother who gave birth at a hospital outside the district still counts here.
Overview
- 975 live births in Chichester district in 2025, up 18 (1.9%) on 2024’s 957.
- 1,051 births in 2015, so the ten-year fall is 76 births, or 7.2%.
- 15.9% was the fall across England over the same ten years, more than twice Chichester’s.
- 1.45 children per woman was Chichester’s total fertility rate in 2025, above England’s 1.39.
Ten years of fewer babies, but a smaller drop than most
England registered 664,399 births in 2015 and 558,988 in 2025, according to the ONS 2015 area tables and the 2025 registrations. Chichester’s 2015 figure was 1,051.
Across West Sussex, births fell from 8,974 to 7,699, a drop of 14.2%. Only Mid Sussex and Horsham fell by less than Chichester. The coastal districts to the east fell furthest:
| District | 2015 | 2025 | Change |
|---|---|---|---|
| Mid Sussex | 1,593 | 1,564 | down 1.8% |
| Horsham | 1,264 | 1,191 | down 5.8% |
| Chichester | 1,051 | 975 | down 7.2% |
| Crawley | 1,642 | 1,376 | down 16.2% |
| Arun | 1,517 | 1,243 | down 18.1% |
| Worthing | 1,183 | 869 | down 26.5% |
| Adur | 724 | 481 | down 33.6% |
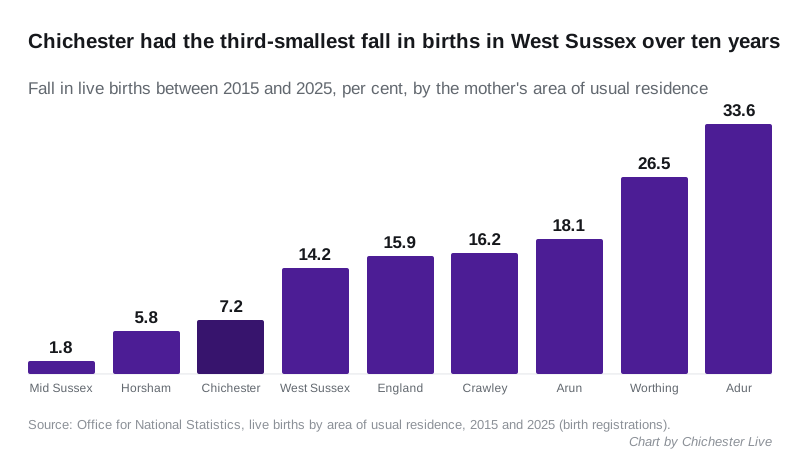
Fewer births for the size of the district
The district’s population has grown since 2015, so the fall looks larger when births are measured against it.
The ONS put Chichester’s births at 9.0 for every 1,000 residents in 2015. In 2025 it was 7.5. Births for every 1,000 women aged 15 to 44 fell from 58.5 to 46.8.
Each year’s rates are worked out from the population estimates of that time, so treat the ten-year comparison of rates as a guide rather than an exact measure. The counts of births are not affected.
2025 in more detail
Of the 975 babies, 523 were boys and 452 were girls. Just over half, 514, were born to parents who were married or in a civil partnership.
Chichester’s total fertility rate, the average number of children a woman would have at the year’s birth rates, was 1.45. That matched West Sussex as a whole and sat above England’s 1.39. The ONS 2025 births bulletin has the national picture.
What it means for you
- Starting school. Children born between 1 January and 31 August 2025 start reception in September 2029. Those born from September to December 2025 start in September 2030.
- Family services. Births are one of the numbers councils and the NHS use to plan nursery, school and maternity places.
- The figures to watch. The ONS publishes 2026 birth registrations next year. A second year of growth would be the first sign that the long fall has stopped locally.
Have your say