
Chichester's claimant count rose by 20 in a year to 2,325 in September, the smallest rise in West Sussex. Under-25 claims are up 13.6%; August was revised down.
Chichester district had 2,325 people on the claimant count in September 2026. That is 20 more than a year earlier, a rise of 0.9 per cent and the smallest of the seven West Sussex districts.
Across West Sussex the count rose 5.6 per cent over the same twelve months. England’s rose 2.6 per cent. Chichester’s rate is 3.2 per cent of residents aged 16 to 64, against 4.1 per cent for England.
The figures are the ONS and DWP claimant count, published through nomis at 7am on 20 October 2026.
August was revised down by 45
Last month we reported an August count of 2,365 and a July to August jump of 75, the biggest for that month since 2020. That was the first estimate. In this release the ONS has revised August to 2,320, so the July to August rise was 30, not 75.
Claimant counts are routinely revised in the month after first publication, as late claims are processed. We have added a dated note to our August story. Measured on the revised figure, September was up 5 on August.
Young claimants up, middle-aged claimants down
The flat headline hides two moves in opposite directions. Year on year, across the district:
- 16 to 24: up from 330 to 375, a rise of 45, or 13.6 per cent
- 25 to 49: down from 1,335 to 1,280, a fall of 55, or 4.1 per cent
- 50 and over: up from 640 to 670, a rise of 30, or 4.7 per cent
So the under-25 rise we flagged in August has held. Within it, the 18 to 21 group went from 195 to 225.
The under-25 rise is not special to Chichester. It is 13.4 per cent across West Sussex and 10.3 per cent across England, where the count went from 273,345 to 301,395. Every West Sussex district rose by between 8.9 per cent (Arun) and 19.5 per cent (Crawley).
What sets Chichester apart is the 25 to 49 band. It fell 4.1 per cent here. Across West Sussex it rose 2.5 per cent, from 9,065 to 9,290, and across England it fell 0.8 per cent. In Chichester it fell in every five-year group bar one:
| Age | September 2025 | September 2026 |
|---|---|---|
| 25 to 29 | 245 | 250 |
| 30 to 34 | 290 | 270 |
| 35 to 39 | 310 | 305 |
| 40 to 44 | 255 | 225 |
| 45 to 49 | 235 | 230 |
How Chichester compares across West Sussex
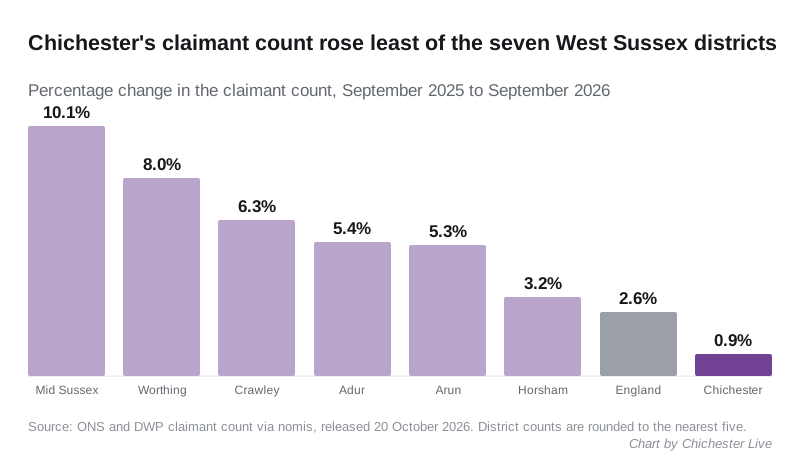
| District | September 2026 | Rate | Change on the year |
|---|---|---|---|
| Crawley | 3,775 | 4.7% | +225 (+6.3%) |
| Arun | 3,490 | 3.7% | +175 (+5.3%) |
| Worthing | 2,305 | 3.3% | +170 (+8.0%) |
| Chichester | 2,325 | 3.2% | +20 (+0.9%) |
| Adur | 1,175 | 3.1% | +60 (+5.4%) |
| Mid Sussex | 2,075 | 2.1% | +190 (+10.1%) |
| Horsham | 1,790 | 2.0% | +55 (+3.2%) |
West Sussex as a whole has 16,935 claimants, up from 16,035. Chichester accounts for 20 of that rise of 900.
Nomis rounds district figures to the nearest five. A change of 20 on a base of 2,305 is real in direction but small enough that the exact percentage should not be leaned on.
Seven Septembers
The district’s September count over the last seven years:
- 2020: 3,415
- 2021: 2,535
- 2022: 1,950
- 2023: 1,990
- 2024: 2,350
- 2025: 2,305
- 2026: 2,325
This September is below September 2024 and well below the pandemic peak, but about 375 above 2022.
What the claimant count counts
The claimant count is not an unemployment rate. The ONS says so in its own methodology: it counts people claiming Jobseeker’s Allowance, plus Universal Credit claimants who are required to look for work. Someone working part time on low pay can be in it. Changes to who must seek work move the number without anything changing locally.
What it means for you
- If you are 16 to 24 and looking for work here, the figures say you are part of a county-wide and national rise, not a local one. Under-25 claims have been above the level of a year earlier for months.
- If you are 25 to 49, the district’s claimant numbers in your age group are lower than a year ago, while they rose across the rest of West Sussex.
- The district’s free Energy Advice Service has been funded for another year. Chichester District Council’s Cabinet agreed £20,000 for it in September, as we reported in our August story, which lists what the service offers.
For the much wider spread between wards, see our ward breakdown. The October figures are due in November.
More Chichester information: house prices, council tax bands and bin collection days.
Have your say