
The district average fell £9,921 in a year to £429,978, the 25th steepest drop of 295 English districts. Only 62 fell at all, and Horsham is now dearer.
The average home in Chichester district sold for £429,978 in June 2026, down £9,921 on a year earlier and the lowest monthly figure since February 2024. That is a fall of 2.3 per cent over the year, in a month when England as a whole rose 1.8 per cent.
The figures are the June 2026 release of the UK House Price Index, compiled by HM Land Registry from completed sales.
Chichester is one of 62 English districts going backwards
Set against every local authority district in England, Chichester’s fall is unusual. Of the 295 districts, 62 recorded an annual fall, and Chichester’s 2.3 per cent drop is the 25th steepest of the 295.
West Sussex is doing much of the falling. Four of its seven districts are down on the year, and two of them, Worthing and Chichester, are in England’s steepest 25.
| District | Average price | Annual change | Rank of 295 English districts |
|---|---|---|---|
| Horsham | £436,940 | -0.2% | 58th steepest |
| Chichester | £429,978 | -2.3% | 25th steepest |
| Mid Sussex | £426,441 | -0.9% | 44th steepest |
| Adur | £380,031 | +1.8% | 107th |
| Crawley | £338,311 | +4.5% | 204th |
| Arun | £321,927 | +3.1% | 158th |
| Worthing | £296,227 | -5.1% | 12th steepest |
For context: West Sussex as a county is flat on the year at £372,660, the South East is up 0.3 per cent at £380,380, and England is up 1.8 per cent at £293,262.
Chichester is no longer the county’s dearest district
A year ago Chichester was the most expensive place to buy in West Sussex, on £439,899 against Horsham’s £437,889. Horsham first went ahead in July 2025, and has been ahead every month since November 2025. The gap in June 2026 is £6,962.
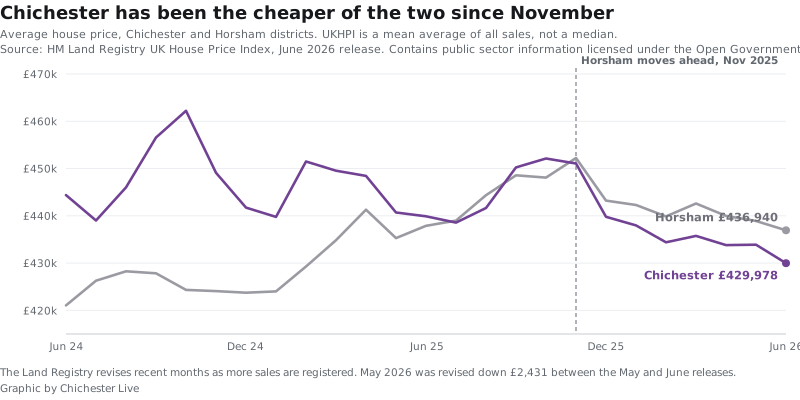
Chichester’s own peak was £466,419 in October 2022. June 2026 is £36,441 below it, a drop of 7.8 per cent over three years and eight months.
Flats fell hardest, semis barely moved
The index splits the district by property type. Over the twelve months to June 2026:
- Detached: £682,816, down 2.8 per cent
- Semi-detached: £424,454, down 1.1 per cent
- Terraced: £343,728, down 1.2 per cent
- Flats and maisonettes: £216,673, down 4.2 per cent
The flat figure is the one to watch. It has fallen more than twice as fast as the terraced figure, and flats are the cheapest way into the district, so this is the part of the market that first-time buyers and downsizers actually use.
The first-time buyer average is £337,703, down 1.7 per cent on the year.
One number that is not what it looks like
UKHPI is a mean average of all sales, not a median. A handful of large sales in the villages, or a quiet month in the city, will move it. It is a good measure of the direction a district is travelling in and a poor guide to what any particular house is worth.
Two more things worth knowing before quoting the figure:
- The Land Registry revises recent months as more sales are registered. May 2026 was first published as £436,312 and has now been revised down to £433,881, a change of £2,431. Any figure less than about three months old is provisional.
- Sales volumes lag further still. The counts for May and June 2026 are not published yet. The most recent are 82 sales in March 2026 and 91 in April.
Those April figures also show why the 2025 comparison is awkward. The stamp duty thresholds changed on 1 April 2025, so March 2025 recorded 285 sales in the district and April 2025 just 63, as buyers rushed to complete. Comparisons through that window say more about the tax deadline than about the market.
What it means for you
If you are buying, £9,921 off the average is real but not transformative against a deposit. The more useful finding is the split: flats are down 4.2 per cent and semis 1.1 per cent, so where you are looking matters more than when.
If you are selling, the district average has fallen in five of the last seven months and now sits £21,087 below its November 2025 level. Chichester’s figure has been below Horsham’s throughout that period, which is a change from the pattern of a year ago.
If you are staying put, the number that affects your bill is not this one. Council tax bands are set on 1991 values and do not move with the index.
We will report the July 2026 figures when the Land Registry publishes them in September, and we will say what May and June were revised to.
Update, 27 September 2026: HM Land Registry has since revised the June figures. The June 2026 average now stands at £432,369, down 1.7 per cent on the year rather than 2.3 per cent, which makes it the 36th steepest fall of 295 districts rather than the 25th. On the revised figures 63 districts fell. May 2026 now stands at £437,152. Horsham’s revised June figure is £436,790, so the gap between the two districts that month was £4,421, not £6,962. The figures above are as first published. The July 2026 release is covered in Chichester house prices: £432,078, down £5,980 in a year.
More Chichester information: house prices in detail, by street and property type, planning news, roadworks and travel and trains to London.
Have your say