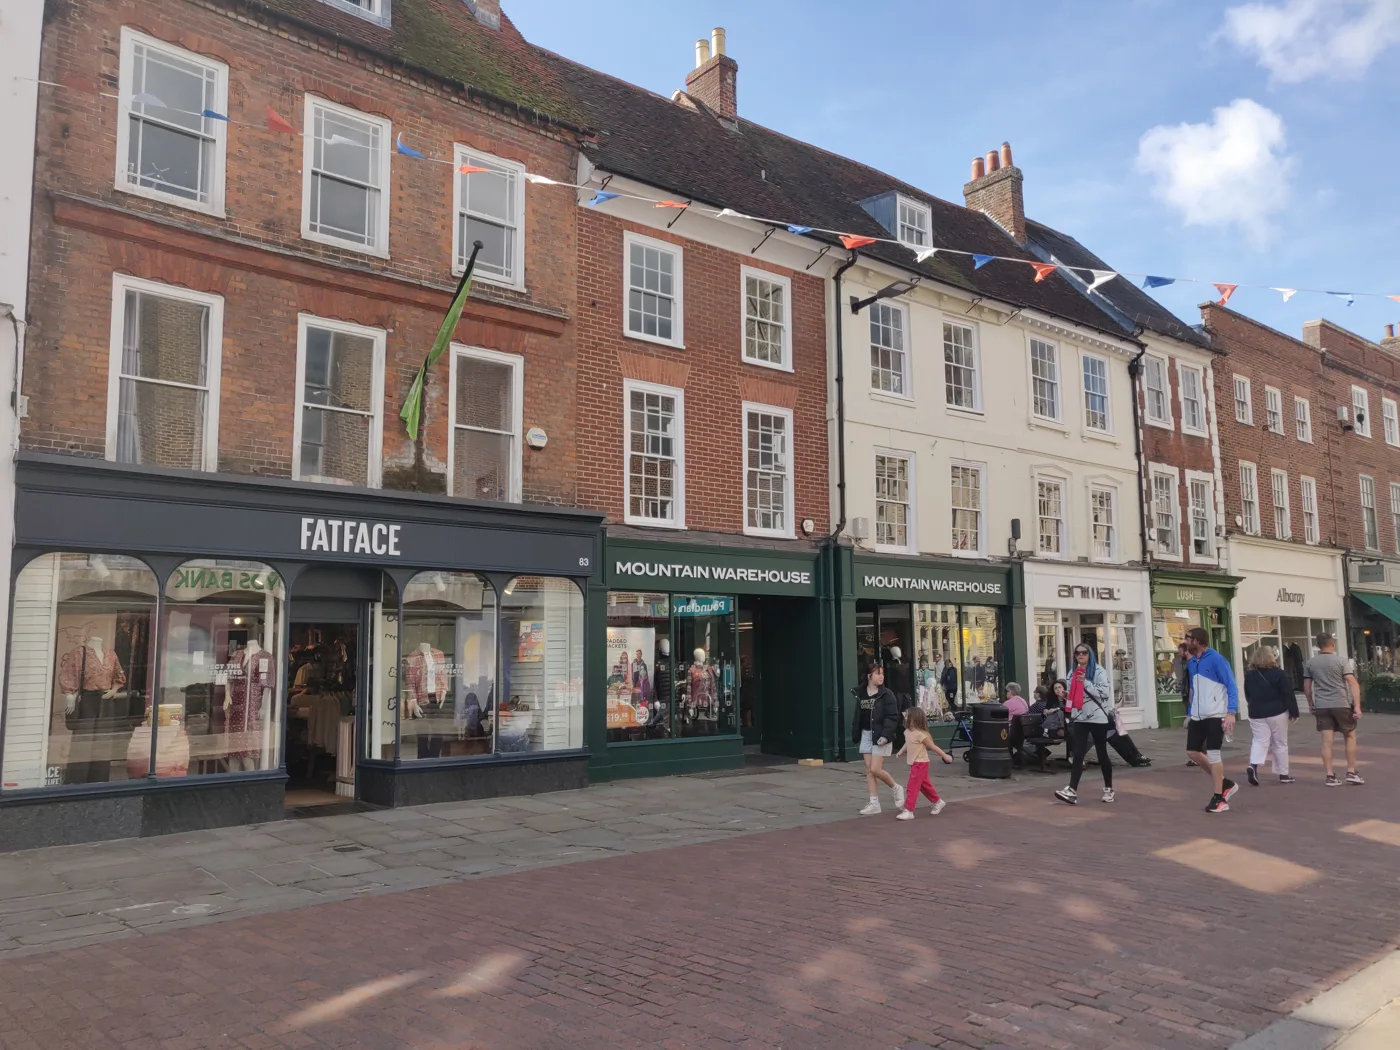

449 crimes and anti-social behaviour reports in central Chichester in August, up from 343. Shoplifting rose 37% over the year and robbery doubled.
Police recorded 449 crimes and anti-social behaviour reports within a mile of central Chichester in August 2026. That is 106 more than in August 2025, a rise of 31 per cent.
August was not a one-off. July had 498, the highest month in the two years we checked. Over the 12 months to August, recorded crime and anti-social behaviour rose by 12 per cent.
Two things drive most of it: shoplifting and anti-social behaviour. Shoplifting went up by 37 per cent over the year. Anti-social behaviour went up by 34 per cent. Robbery, a much smaller category, nearly doubled.
The figures come from police.uk, which publishes every report Sussex Police records, mapped to the nearest street. We downloaded 24 months of them through the data.police.uk API on 4 October, using the same one-mile circle around the city centre each month.
August in numbers
| Type | August 2025 | August 2026 |
|---|---|---|
| Anti-social behaviour | 88 | 131 |
| Violence and sexual offences | 101 | 128 |
| Shoplifting | 29 | 67 |
| Criminal damage and arson | 22 | 33 |
| Public order | 35 | 28 |
| Other theft | 18 | 17 |
| Drugs | 5 | 11 |
| Vehicle crime | 6 | 9 |
| Burglary | 9 | 7 |
| Bicycle theft | 15 | 6 |
| Everything else | 15 | 12 |
| Total | 343 | 449 |
Shoplifting more than doubled on the month, from 29 reports to 67. Anti-social behaviour rose by 43 reports and violence by 27.
A year of change
A single month can swing a lot, so we also compared the 12 months to August 2026 with the 12 months before.
| Type | Sep 2024 to Aug 2025 | Sep 2025 to Aug 2026 | Change |
|---|---|---|---|
| Violence and sexual offences | 1,225 | 1,250 | up 2% |
| Anti-social behaviour | 844 | 1,127 | up 34% |
| Shoplifting | 441 | 605 | up 37% |
| Public order | 359 | 410 | up 14% |
| Criminal damage and arson | 298 | 350 | up 17% |
| Other theft | 221 | 213 | down 4% |
| Burglary | 117 | 100 | down 15% |
| Drugs | 114 | 97 | down 15% |
| Bicycle theft | 102 | 81 | down 21% |
| Vehicle crime | 94 | 81 | down 14% |
| Robbery | 31 | 61 | up 97% |
| Possession of weapons | 64 | 58 | down 9% |
| Theft from the person | 44 | 21 | down 52% |
| Other crime | 59 | 55 | down 7% |
| Total | 4,013 | 4,509 | up 12% |
| Total, excluding anti-social behaviour | 3,169 | 3,382 | up 7% |
The picture is mixed rather than uniformly worse. The rises are:
- Shoplifting, up 164 reports to 605.
- Anti-social behaviour, up 283 reports to 1,127.
- Robbery, from 31 reports to 61. The numbers are small, but it nearly doubled.
- Criminal damage, up 17 per cent, and public order offences, up 14 per cent.
Several types fell. Theft from the person halved, from 44 reports to 21. Bicycle theft fell by a fifth, and burglary, drugs and vehicle crime each fell by about 15 per cent.
Violence and sexual offences, the largest category, barely moved: 1,250 reports against 1,225.
Shoplifting: three quarters of the rise at one map point
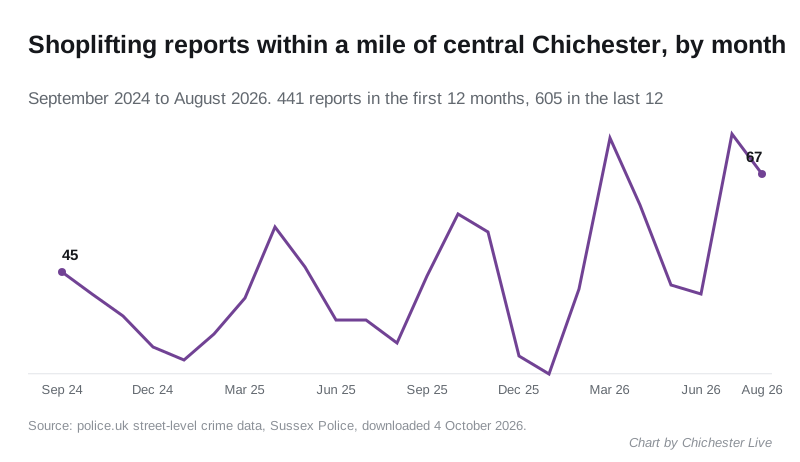
Shoplifting ran at 25 to 55 reports a month through the first year. In the second it went above 55 in five months, peaking at 75 in March 2026 and 76 in July. August had 67.
Police.uk places each report at the nearest of a set of anonymous map points, not at the real address. One of those points, which police.uk labels only “Supermarket”, sits near the eastern end of East Street, towards Eastgate Square.
That single point carried 233 shoplifting reports in the 12 months to August, against 109 the year before. It accounts for about three quarters of the whole rise. In August alone it had 45 of the 67 reports.
Because the point is a map anchor rather than an address, it can collect reports from more than one shop nearby. We have not guessed which business is involved.
The next busiest point, St Martin’s Street, went the other way: 105 reports against 118.
Of August’s 67 shoplifting reports, police.uk lists:
- 37 as still under investigation
- 29 as investigation complete with no suspect identified
- 1 as unable to prosecute the suspect
Anti-social behaviour, a year after the street drinking order
Anti-social behaviour is up by a third. Every one of the last 12 months had more reports than the same month a year earlier. The most-used map points for it were the same East Street “Supermarket” point (82 reports), a point labelled “Parking Area” (52) and Cooper Street (40).
The district council’s Cabinet imposed a Public Space Protection Order on the city centre on 10 June 2025, after what it called “a significant increase in anti-social behaviour”, in particular street drinking. The council said the problems had largely affected Eastgate Square.
The order runs until 2028. It lets police and authorised officers confiscate alcohol where public drinking causes, or could cause, anti-social behaviour.
These figures cannot tell you whether the order is working. More enforcement can mean more incidents recorded, and anti-social behaviour reports depend heavily on how many people call them in.
How to read these figures
- The counts cover a circle with a radius of one mile around central Chichester, not the whole district. Selsey, Midhurst, Petworth and the Witterings are outside it.
- Recorded crime reflects what is reported and how it is recorded. A change can come from policing activity, or from shops reporting more, as well as from crime itself.
- Police.uk does not split violence and sexual offences further. The category runs from harassment and common assault to serious injury.
- Figures are revised. A month can change after it is first published.
What it means for you
- Report non-emergency crime and anti-social behaviour to Sussex Police online or on 101. Call 999 if a crime is happening or someone is in danger.
- You can check the reports mapped to your own street on police.uk.
- If anti-social behaviour near you keeps happening and you feel nothing has been done, you can ask for an anti-social behaviour case review through the district council.
- The council’s community safety pages explain what the Chichester Community Safety Partnership does.
We will update these figures each month as police.uk publishes them. For other local numbers, see our house prices page.
Sources
- police.uk, Sussex Police neighbourhood data, downloaded through the data.police.uk street-level crime API on 4 October 2026 for every month from September 2024 to August 2026, centred on Chichester city centre (50.8379, -0.7828). Open Government Licence.
- Chichester District Council, Order is imposed to help reduce anti-social behaviour in Chichester city centre.
Have your say