
The average Chichester district home fell to £422,234 in September, down 5.8% on a year. Only eight of England's 295 districts fell faster.
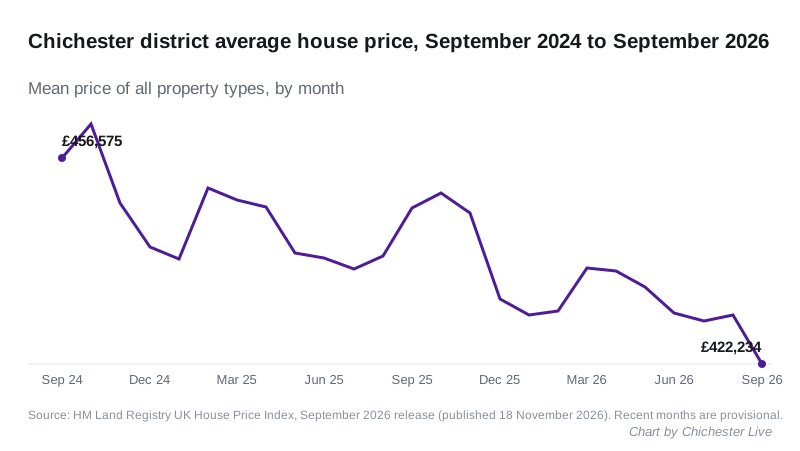
The average home in Chichester district sold for £422,234 in September 2026. That is £26,010 less than a year earlier, a fall of 5.8 per cent. It is the lowest monthly figure since November 2021. England rose 0.8 per cent over the same year.
The figures come from the September release of the UK House Price Index, which HM Land Registry compiles from completed sales. It was published on Wednesday 18 November.
The district average fell 1.9 per cent in the month alone, from £430,423 in August.
Ninth steepest fall in England
Across England’s 295 local authority districts, 108 recorded a fall in the year to September. Chichester’s 5.8 per cent is joint ninth steepest, level with Dartford.
Seven of the eight districts ahead of it are in central London, led by Westminster at 18.5 per cent. The eighth is Derbyshire Dales, down 6.3 per cent. That leaves Chichester and Dartford as the steepest fallers in the South East.
The figures are from the UK HPI full data file for September 2026.
Third in West Sussex now
Chichester used to be the dearest district in the county. Horsham went ahead in 2025. On the revised figures, Mid Sussex has now been ahead for three months running as well.
| District | Average price | Change on a year | Annual change |
|---|---|---|---|
| Horsham | £450,863 | +£4,012 | +0.9% |
| Mid Sussex | £439,349 | -£1,147 | -0.3% |
| Chichester | £422,234 | -£26,010 | -5.8% |
| Adur | £375,922 | -£4,034 | -1.1% |
| Crawley | £328,778 | -£2,693 | -0.8% |
| Arun | £319,341 | -£5,294 | -1.6% |
| Worthing | £297,239 | -£9,290 | -3.0% |
Horsham is now £28,629 ahead of Chichester, and Mid Sussex £17,115 ahead.
For comparison:
- West Sussex is down 1.6 per cent at £374,156
- the South East is down 0.2 per cent at £378,915
- England is up 0.8 per cent at £292,998
Over the Hampshire border, Havant is down 1.1 per cent at £315,359. East Hampshire is down 0.1 per cent at £443,579.
Every type of home fell
The index splits the district’s sales by property type. Over the twelve months to September 2026:
- Detached: £671,079, down 5.6 per cent
- Semi-detached: £417,000, down 4.9 per cent
- Terraced: £337,721, down 5.6 per cent
- Flats and maisonettes: £212,015, down 8.2 per cent
Flats have been the steepest faller in every release we have reported since June. The first-time buyer average is £331,119, down 5.7 per cent. Former owner-occupiers moving home paid an average of £503,439, down 5.8 per cent.
Why the annual fall looks so large
Part of the drop is the comparison month. September 2025 was a strong month for the district: the average rose 1.8 per cent in that month alone, to £448,244. Measuring against a high point makes this year’s fall look bigger.
Even so, the direction is clear. The district peaked at £466,419 in October 2022, and September 2026 is £44,185 below that peak, a fall of 9.5 per cent. Two years ago, in September 2024, the average was £456,575.
July and August have both moved
Land Registry revises recent months as more sales are registered.
- July 2026 was first published at £432,078, down 1.4 per cent on the year. It now stands at £429,372, down 2.0 per cent.
- August 2026 was first published at £428,364, down 2.7 per cent. It now stands at £430,423, down 2.2 per cent.
We have added a dated note to our July house prices story. We did not report August separately.
September is a first estimate and will move too. The index gives no sales count for it yet. In July, the latest month with a count, it was built from 101 sales in the district, against 155 in September 2025.
One number that is not what it looks like
UKHPI is a mean average of sales, not a median. A few large sales in the villages, or a quiet month in the city, will move it. With around a hundred sales a month in the district, a single month can swing more than the market really has. It is a good guide to direction and a poor guide to what any particular house is worth.
What it means for you
If you are buying, the district average is lower than at any point since late 2021. Flats have fallen furthest, down 8.2 per cent, and they are the cheapest way into the district.
If you are selling, a price based on what a neighbour got in 2024 or 2025 may now be too high. Recent completions nearby are the better guide, and sold prices by place are on our Chichester house prices page.
If you are staying put, none of this changes your council tax. Bands are set on 1991 values and do not move with the index.
The October 2026 figures are due from the Land Registry in December.
Sources
- UK House Price Index, Chichester, September 2024 to September 2026, HM Land Registry
- UK HPI full data file, September 2026, HM Land Registry, for every district’s figures, the England ranking and the revised July and August figures
- UKHPI linked data, Chichester, September 2026, HM Land Registry, for the property-type and buyer-type figures
Have your say